As we say goodbye to 2013, the economy is still failing ordinary workers.
What is being done to make it better? Not enough.
Public spending and public investment are too low, wages for increasingly productive workers are flat or falling, and the minimum wage is inadequate.
However, there is hope for 2014.
The policies that created these trends can be reversed. There is a renewed push to raise the federal minimum wage, states are raising their own minimum wages, and more policymakers are coming to terms with the downside of economic inequality.
EPI’s top charts of 2013 explain why a full economic recovery and policies that ensure broadly shared prosperity should be policymakers’ foremost priorities in 2014.
Source: huffingtonpost.com/
Author: Economic Policy Institute
What is being done to make it better? Not enough.
Public spending and public investment are too low, wages for increasingly productive workers are flat or falling, and the minimum wage is inadequate.
However, there is hope for 2014.
The policies that created these trends can be reversed. There is a renewed push to raise the federal minimum wage, states are raising their own minimum wages, and more policymakers are coming to terms with the downside of economic inequality.
EPI’s top charts of 2013 explain why a full economic recovery and policies that ensure broadly shared prosperity should be policymakers’ foremost priorities in 2014.
-
1 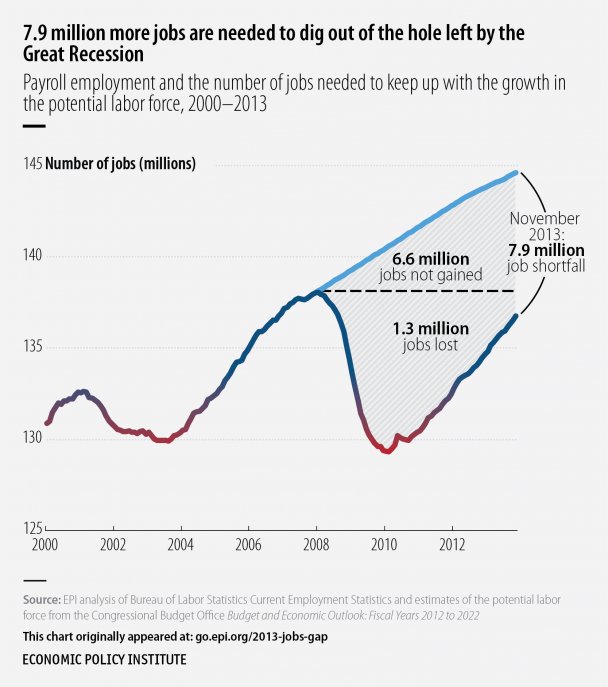 EPI
In November 2013, the labor market had 1.3 million fewer jobs than when the recession began in December 2007. Further, because the potential labor force grows every month, the economy would have had to add 6.6 million jobs just to preserve the labor market health that prevailed in December 2007. Counting jobs lost plus jobs that should have been gained to absorb potential new labor market entrants, the U.S. economy had a jobs shortfall of 7.9 million in November 2013.
EPI
In November 2013, the labor market had 1.3 million fewer jobs than when the recession began in December 2007. Further, because the potential labor force grows every month, the economy would have had to add 6.6 million jobs just to preserve the labor market health that prevailed in December 2007. Counting jobs lost plus jobs that should have been gained to absorb potential new labor market entrants, the U.S. economy had a jobs shortfall of 7.9 million in November 2013.
Adapted from: “Recession Has Left in Its Wake a Jobs Shortfall of Nearly 8 Million,” an EPI Economic Indicator updated Dec. 6, 2013, on www.stateofworkingamerica.org -
2 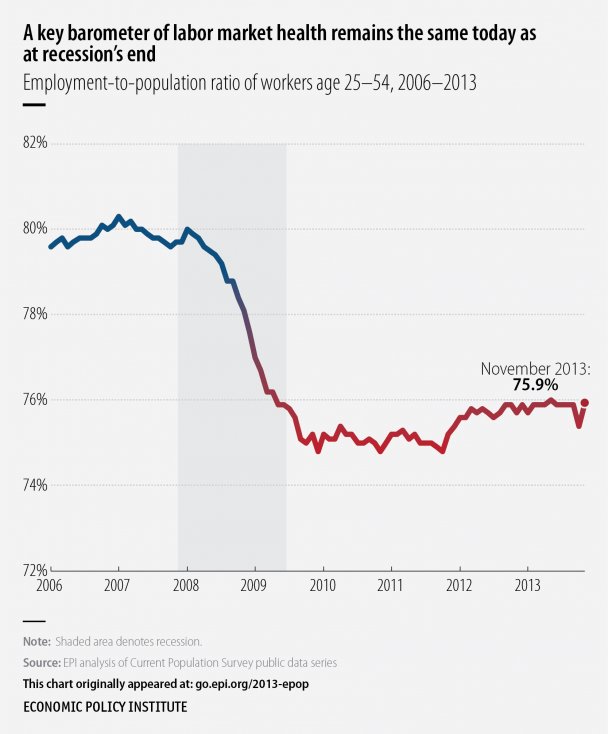 EPI
One of the best measures of labor market health is the share of 25- to 54-year-olds with a job. Looking at 25- to 54-year-olds instead of the entire working-age population provides more certainty that the trends we see are being driven by reduced demand for workers and not supply-related factors such as retiring baby boomers or increased college enrollment of young people. This ratio deteriorated dramatically through late 2009, essentially stalled for two years, and improved modestly over the last two years. But the 75.9 percent share of 25- to 54-year-olds with a job in November 2013 is identical to the share at the official end of the Great Recession in June 2009.
EPI
One of the best measures of labor market health is the share of 25- to 54-year-olds with a job. Looking at 25- to 54-year-olds instead of the entire working-age population provides more certainty that the trends we see are being driven by reduced demand for workers and not supply-related factors such as retiring baby boomers or increased college enrollment of young people. This ratio deteriorated dramatically through late 2009, essentially stalled for two years, and improved modestly over the last two years. But the 75.9 percent share of 25- to 54-year-olds with a job in November 2013 is identical to the share at the official end of the Great Recession in June 2009.
Adapted from: “Drop in Employment for ‘Prime-age’ Workers during 2007 Recession Truly Stunning,” an EPI Economic Indicator updated Dec. 6, 2013, on www.stateofworkingamerica.org -
3 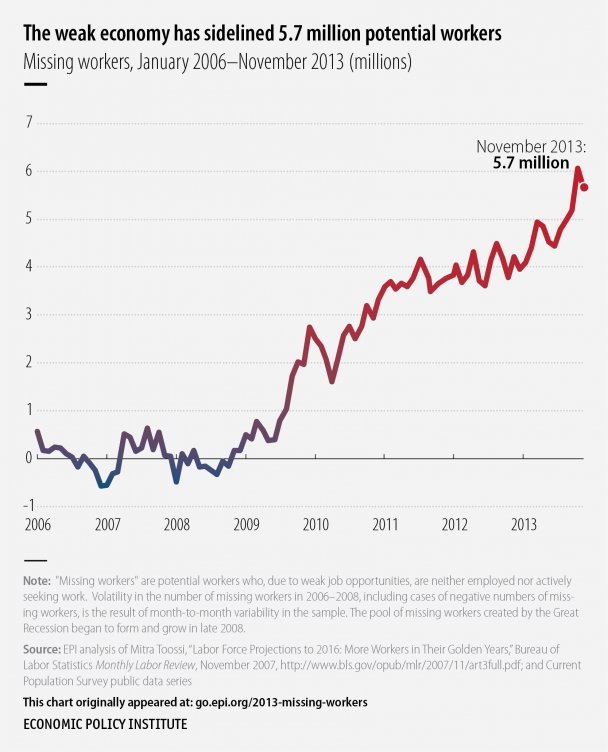 EPI
In today’s labor market, the headline unemployment rate drastically understates the weakness of job opportunities because it does not count the large pool of “missing workers”—potential workers who, due to weak job opportunities, are neither employed nor actively seeking a job. These are people who would very likely be either working or looking for work if job opportunities were significantly stronger. In November 2013, there were 5.7 million missing workers. If they were looking for work and therefore counted as unemployed, the unemployment rate in November 2013 would have been 10.3 percent, significantly above the official 7.0 percent rate.
EPI
In today’s labor market, the headline unemployment rate drastically understates the weakness of job opportunities because it does not count the large pool of “missing workers”—potential workers who, due to weak job opportunities, are neither employed nor actively seeking a job. These are people who would very likely be either working or looking for work if job opportunities were significantly stronger. In November 2013, there were 5.7 million missing workers. If they were looking for work and therefore counted as unemployed, the unemployment rate in November 2013 would have been 10.3 percent, significantly above the official 7.0 percent rate.
Adapted from: “Millions of Potential Workers Sidelined,” an EPI Economic Indicator updated Dec. 6, 2013 -
4 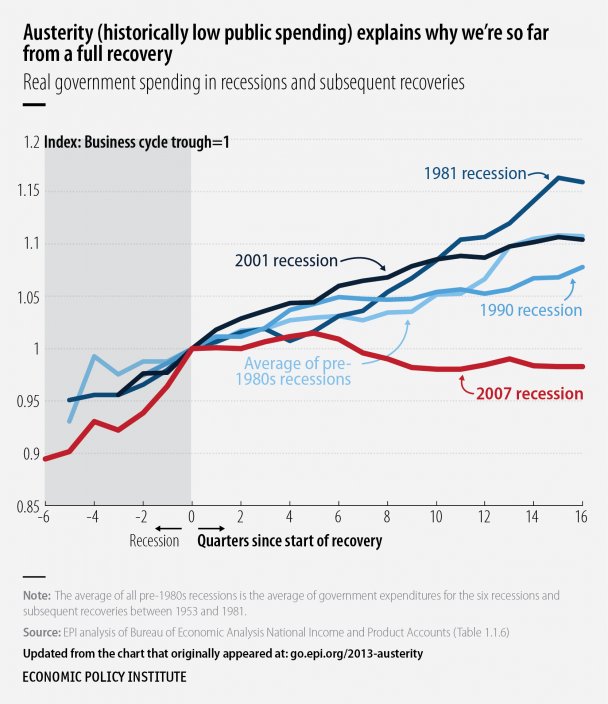 EPI
The recovery from the Great Recession has been accompanied by the slowest growth of public spending following any recession since World War II. If the current recovery had instead featured public spending growth that mirrored spending growth following the early 1980s recession (one that was similarly as deep, if not as long, as the Great Recession), the economy would be almost fully recovered with more than 7 million additional jobs.
EPI
The recovery from the Great Recession has been accompanied by the slowest growth of public spending following any recession since World War II. If the current recovery had instead featured public spending growth that mirrored spending growth following the early 1980s recession (one that was similarly as deep, if not as long, as the Great Recession), the economy would be almost fully recovered with more than 7 million additional jobs.
Adapted from: Taking Middle-Out Economics Seriously in This Fall’s Fiscal Debates, an EPI report published Sept. 26, 2013 -
5 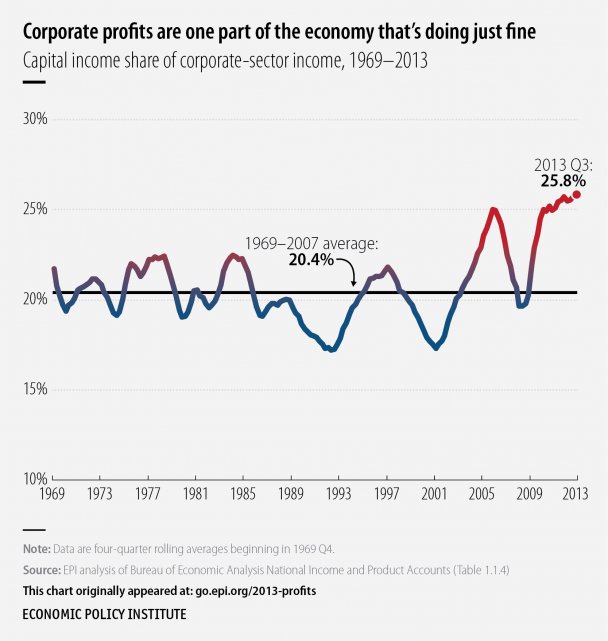 EPI
One economic indicator that has shown extraordinary strength in the recovery from the Great Recession is the share of corporate-sector income claimed by owners of capital instead of employees. By the third quarter of 2013, the share of corporate-sector income accruing to profits and other forms of capital income had reached 25.8 percent, the highest share ever recorded. To put this number into perspective, if the share of corporate-sector income accruing to capital owners in the third quarter of 2013 were 20.4 percent (the 1969–2007 average), every worker in the U.S. economy would have earned $3,200 more in wages.
EPI
One economic indicator that has shown extraordinary strength in the recovery from the Great Recession is the share of corporate-sector income claimed by owners of capital instead of employees. By the third quarter of 2013, the share of corporate-sector income accruing to profits and other forms of capital income had reached 25.8 percent, the highest share ever recorded. To put this number into perspective, if the share of corporate-sector income accruing to capital owners in the third quarter of 2013 were 20.4 percent (the 1969–2007 average), every worker in the U.S. economy would have earned $3,200 more in wages.
Adapted from: “Economy Built for Profits, Not Prosperity,” an EPI Economic Snapshot updated Dec. 6, 2013 -
6 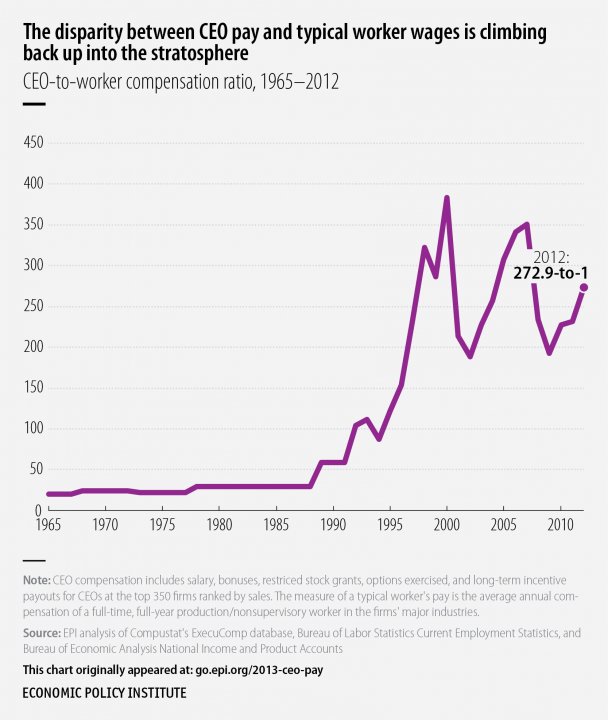 EPI
After shrinking during the recession, the gap between CEO pay and typical worker wages is growing rapidly. The ratio of annual pay received by CEOs of the largest 350 U.S. firms relative to annual wages of production/nonsupervisory workers in those firms’ industries was roughly 20-to-1 in 1965, reached 100-to-1 by 1992, and peaked at 383-to-1 during the stock market bubble of 2000. In 2012, it was 273-to-1.
EPI
After shrinking during the recession, the gap between CEO pay and typical worker wages is growing rapidly. The ratio of annual pay received by CEOs of the largest 350 U.S. firms relative to annual wages of production/nonsupervisory workers in those firms’ industries was roughly 20-to-1 in 1965, reached 100-to-1 by 1992, and peaked at 383-to-1 during the stock market bubble of 2000. In 2012, it was 273-to-1.
Adapted from: CEO Pay in 2012 Was Extraordinarily High Relative to Typical Workers and Other High Earners, an EPI report published June 26, 2013 -
7 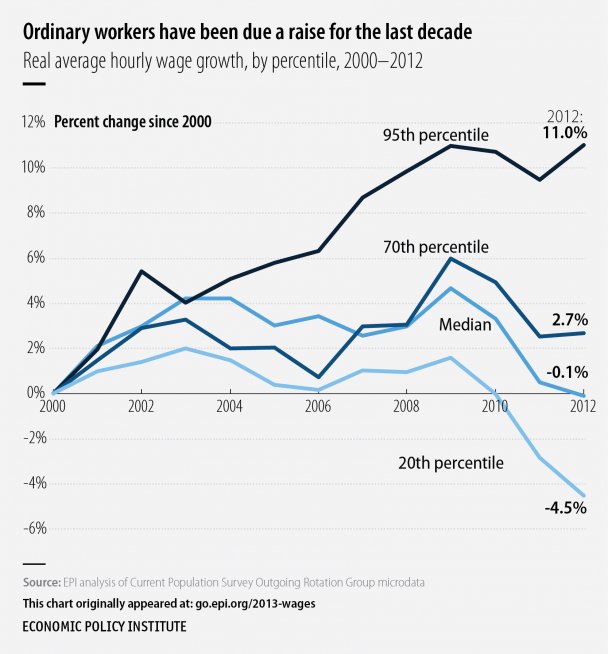 EPI
While CEOs are doing fine in today’s economy, most other U.S. wage earners could badly use a raise—and not just to make up ground lost in the Great Recession. Essentially the bottom 70 percent of American workers have seen flat or falling real (i.e., inflation-adjusted) wages since 2002. The disproportionate income gains going to capital owners rather than workers have slowed the recovery, as a higher share of capital income is saved when it could instead be spent by workers and thus create more demand for goods and services.
EPI
While CEOs are doing fine in today’s economy, most other U.S. wage earners could badly use a raise—and not just to make up ground lost in the Great Recession. Essentially the bottom 70 percent of American workers have seen flat or falling real (i.e., inflation-adjusted) wages since 2002. The disproportionate income gains going to capital owners rather than workers have slowed the recovery, as a higher share of capital income is saved when it could instead be spent by workers and thus create more demand for goods and services.
Adapted from: A Decade of Flat Wages: The Key Barrier to Shared Prosperity and a Rising Middle Class, an EPI report published Aug. 21, 2013 -
8 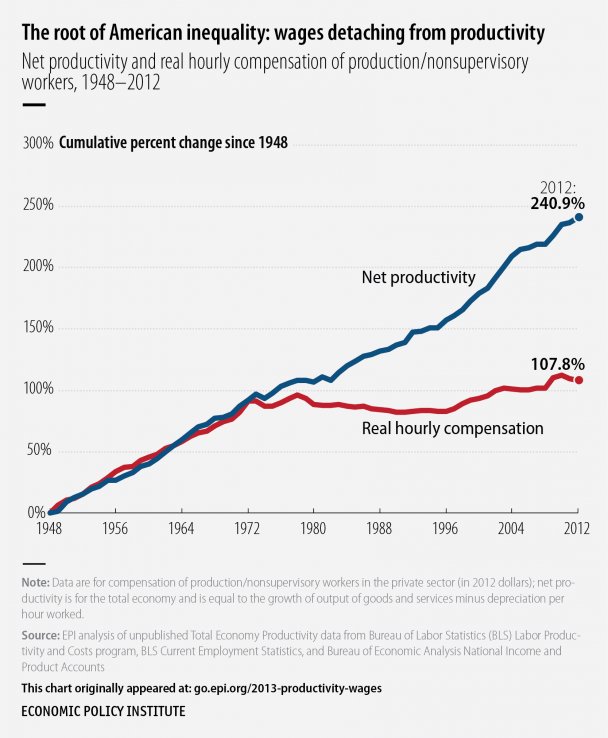 EPI
Wages and productivity grew in tandem during the three decades following World War II. But as EPI began pointing out in the 1994 edition of The State of Working America, this link broke in the late 1970s for the vast majority of American workers. Productivity measures the average dollar value of economic output produced in an hour of work—essentially measuring the economy’s potential for providing rising living standards for all. But this potential has been unrealized for most American workers. Between 1979 and 2012, productivity rose 63.8 percent, but compensation per hour for production and nonsupervisory workers (who constitute 80 percent of the private-sector workforce) rose only 7.5 percent. As a result, an enormous share of economic output is going to profits and earnings of CEOs and other workers much higher up the wage scale—which is why American inequality has skyrocketed over the past generation.
EPI
Wages and productivity grew in tandem during the three decades following World War II. But as EPI began pointing out in the 1994 edition of The State of Working America, this link broke in the late 1970s for the vast majority of American workers. Productivity measures the average dollar value of economic output produced in an hour of work—essentially measuring the economy’s potential for providing rising living standards for all. But this potential has been unrealized for most American workers. Between 1979 and 2012, productivity rose 63.8 percent, but compensation per hour for production and nonsupervisory workers (who constitute 80 percent of the private-sector workforce) rose only 7.5 percent. As a result, an enormous share of economic output is going to profits and earnings of CEOs and other workers much higher up the wage scale—which is why American inequality has skyrocketed over the past generation.
Adapted from: “Cumulative Change in Total Economy Productivity and Real Hourly Compensation of Production/Nonsupervisory Workers, 1948–2012,” an EPI Economic Indicator updated Sept. 4, 2013 -
9 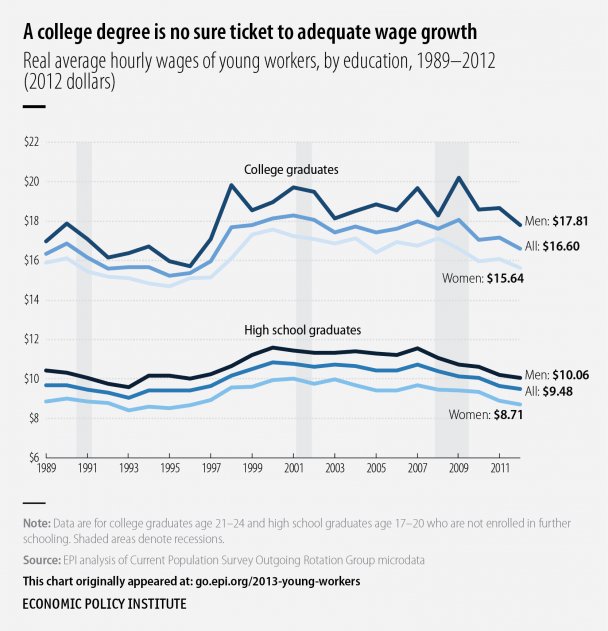 EPI
It’s not just workers with less education who are failing to get their fair share of overall wage growth. For nearly the last quarter century, real wages for young workers with a four-year college degree have essentially stagnated.
EPI
It’s not just workers with less education who are failing to get their fair share of overall wage growth. For nearly the last quarter century, real wages for young workers with a four-year college degree have essentially stagnated.
Adapted from: The Class of 2013: Young Graduates Still Face Dim Job Prospects, an EPI report published April 10, 2013 -
10 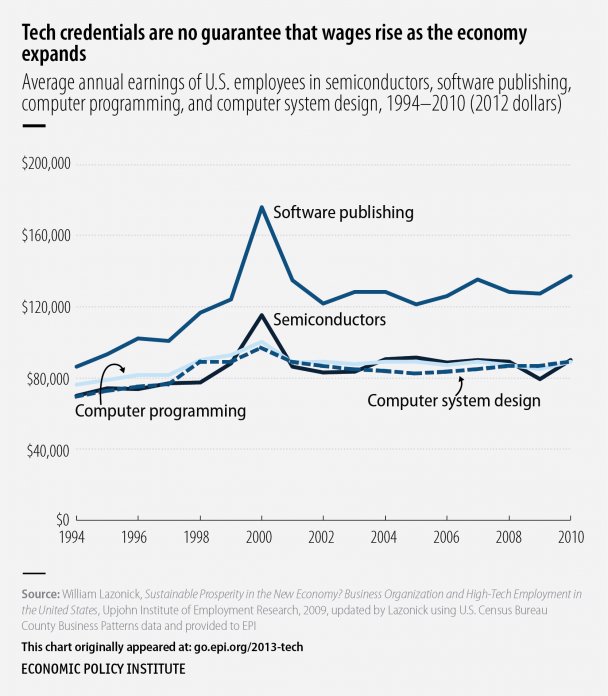 EPI
Sending American workers to computer programming school will not guarantee that their wages will keep pace with economy-wide growth. From 1994 to 2010, real wages for workers in computer occupations like computer programming and computer system design were essentially flat. Besides indicating that American wage problems are not due to workers’ lack of technical skills, wage trends in high-tech occupations also belie claims that the United States needs to give more visas to foreign tech workers because there aren’t enough here. If there were glaring labor shortages in tech sectors, tech-sector wages would be way up.
EPI
Sending American workers to computer programming school will not guarantee that their wages will keep pace with economy-wide growth. From 1994 to 2010, real wages for workers in computer occupations like computer programming and computer system design were essentially flat. Besides indicating that American wage problems are not due to workers’ lack of technical skills, wage trends in high-tech occupations also belie claims that the United States needs to give more visas to foreign tech workers because there aren’t enough here. If there were glaring labor shortages in tech sectors, tech-sector wages would be way up.
Adapted from: Guestworkers in the High-Skill U.S. Labor Market, an EPI report published April 24, 2013 -
11 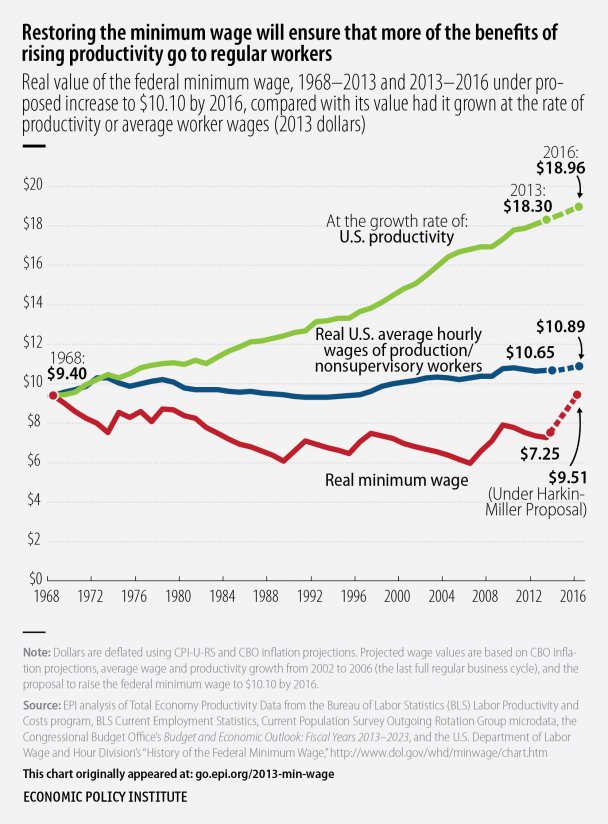 EPI
Every year that the minimum wage is not raised by Congress, its real value is reduced by inflation. This inaction has eroded living standards for low-wage workers. The real value of the minimum wage today, $7.25, is much lower than its height of $9.40 in 1968, despite the 109 percent rise in U.S. productivity since 1968. Today’s minimum wage would be $18.30 if it had grown at the same rate as U.S. productivity.
EPI
Every year that the minimum wage is not raised by Congress, its real value is reduced by inflation. This inaction has eroded living standards for low-wage workers. The real value of the minimum wage today, $7.25, is much lower than its height of $9.40 in 1968, despite the 109 percent rise in U.S. productivity since 1968. Today’s minimum wage would be $18.30 if it had grown at the same rate as U.S. productivity.
Adapted from: Raising the Federal Minimum Wage to $10.10 Would Lift Wages for Millions and Provide a Modest Economic Boost, an EPI report published Dec. 19, 2013 -
12 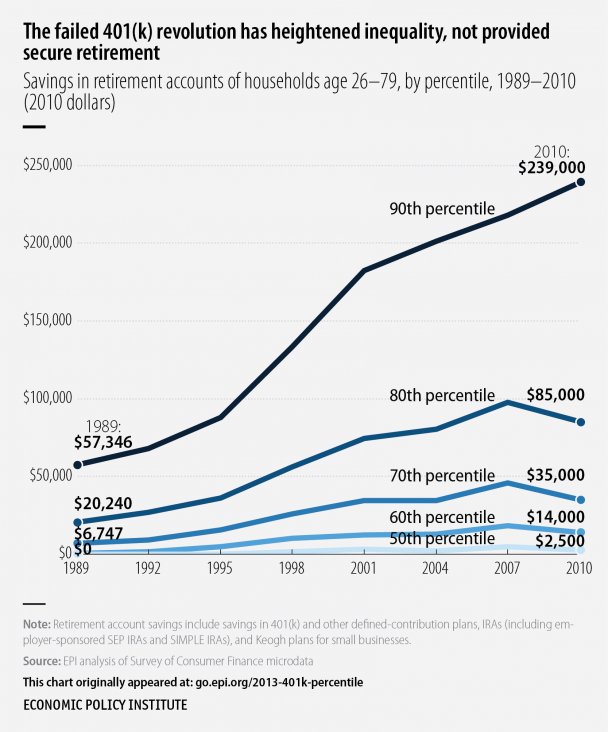 EPI
Inequality in the U.S. economy has many dimensions, including inequalities in retirement security. The generation-long experiment in retirement security policy away from pensions to individual accounts—often called the “401(k) revolution”—has been a clear disaster, generating a few big winners and millions of losers: Most American households now face a deeply insecure retirement. Nearly half of households have no savings in retirement accounts, and a household in the 90th percentile of the retirement savings distribution has nearly 100 times more retirement savings than the median household.
EPI
Inequality in the U.S. economy has many dimensions, including inequalities in retirement security. The generation-long experiment in retirement security policy away from pensions to individual accounts—often called the “401(k) revolution”—has been a clear disaster, generating a few big winners and millions of losers: Most American households now face a deeply insecure retirement. Nearly half of households have no savings in retirement accounts, and a household in the 90th percentile of the retirement savings distribution has nearly 100 times more retirement savings than the median household.
Adapted from: Figure 11 in EPI’s Retirement Inequality Chartbook, published Sept. 6, 2013 -
13 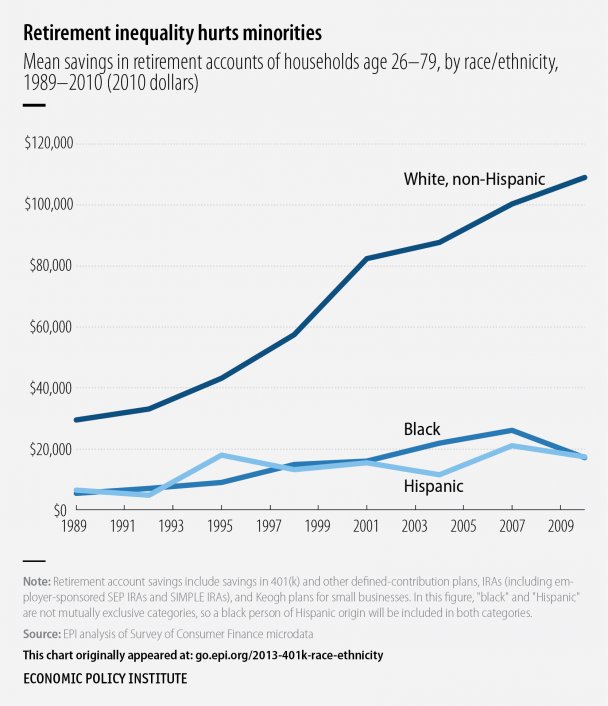 EPI
One of the starkest divides in retirement readiness is by race and ethnicity: White households have more than six times as much saved in retirement accounts on average as Hispanic and black households. Clearly the move away from a retirement system based on pensions to one dependent on 401(k)s has hurt minority households.
EPI
One of the starkest divides in retirement readiness is by race and ethnicity: White households have more than six times as much saved in retirement accounts on average as Hispanic and black households. Clearly the move away from a retirement system based on pensions to one dependent on 401(k)s has hurt minority households.
Adapted from: Figure 26 in EPI’s Retirement Inequality Chartbook, published Sept. 6, 2013
Source: huffingtonpost.com/
Author: Economic Policy Institute
No comments:
Post a Comment